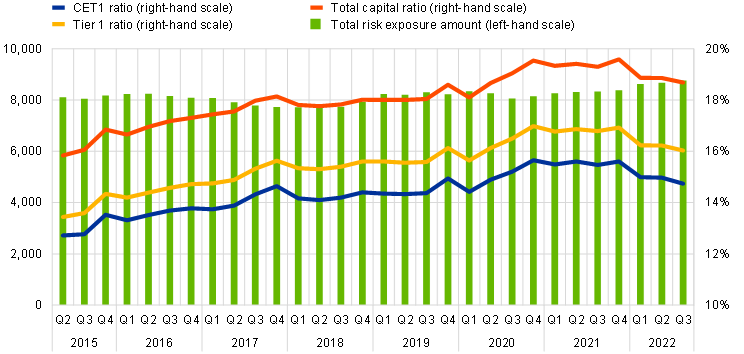
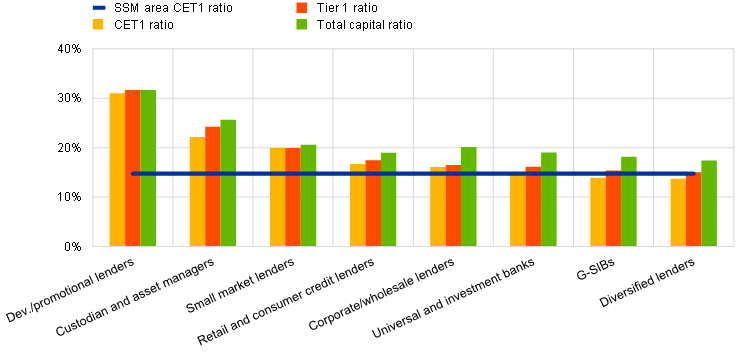
The aggregate capital ratios of significant institutions (i.e. those banks that are supervised directly by the ECB) decreased in the third quarter of 2022. The aggregate Common Equity Tier 1 (CET1) ratio stood at 14.74%, the aggregate Tier 1 ratio stood at 16.03% and the aggregate total capital ratio stood at 18.68%. Aggregate CET1 ratios at country level ranged from 12.48% in Spain to 24.06% in Estonia. Across Single Supervisory Mechanism business model categories, diversified lenders reported the lowest aggregate CET1 ratio (13.74%) and development/promotional lenders reported the highest (31.00%).
Capital ratios and their components by reference period
Capital ratios by home country for the third quarter of 2022

Capital ratios by business model for the third quarter of 2022
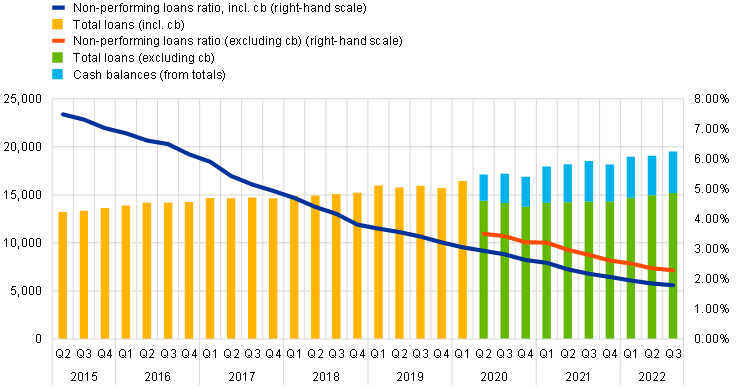
The non-performing loans (NPL) ratio excluding cash balances at central banks and other demand deposits decreased to 2.29% in the third quarter of 2022. The decrease was driven by a further reduction in the stock of NPLs to €348 billion (compared with €351 billion in the previous quarter) as well as an increase in total loans and advances (excluding cash balances) to €15,201 billion (compared with €14,962 billion in the previous quarter).
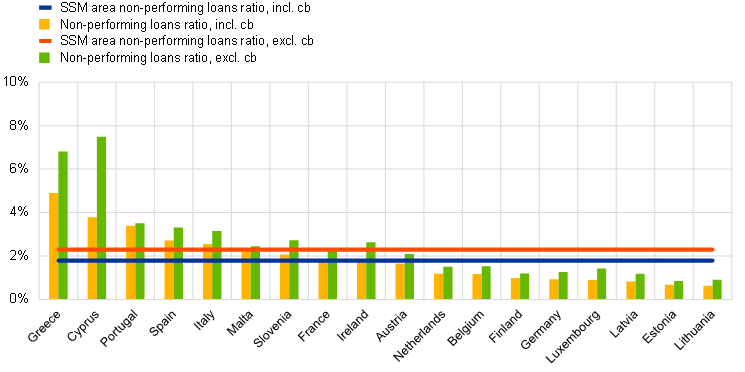
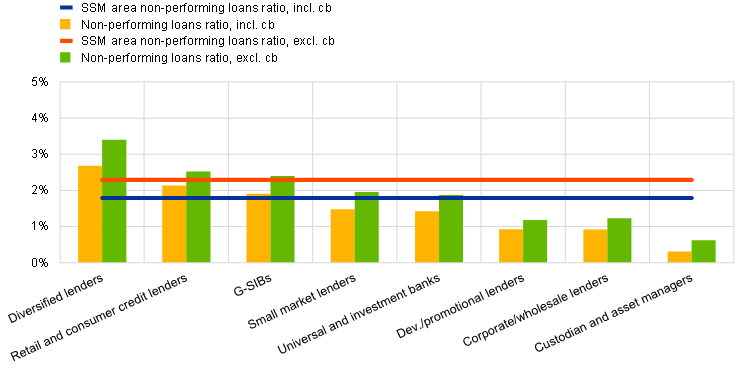
At country level, the average NPL ratio excluding cash balances (green bars on Chart 5) ranged from 0.85% in Estonia to 7.50% in Cyprus. Across business model categories, custodians and asset managers reported the lowest aggregate NPL ratio excluding cash balances (0.62%) and diversified lenders reported the highest (3.40%).
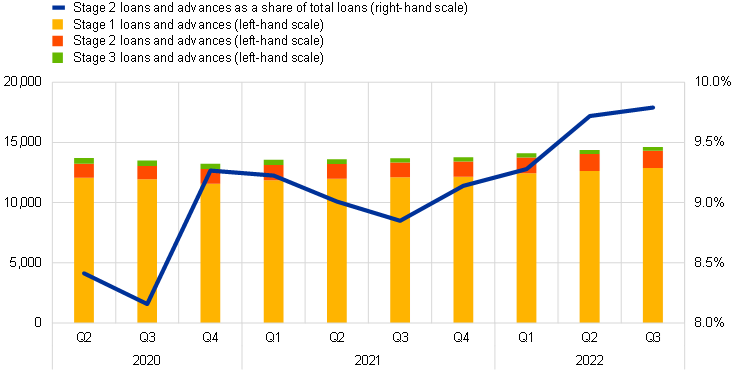
Aggregate stage 2 loans as a share of total loans continued to increase slightly in the third quarter of 2022, reaching 9.79% (up from 9.72% in the previous quarter). The stock of stage 2 loans amounted to €1,434 billion (compared with €1,399 billion in the previous quarter).
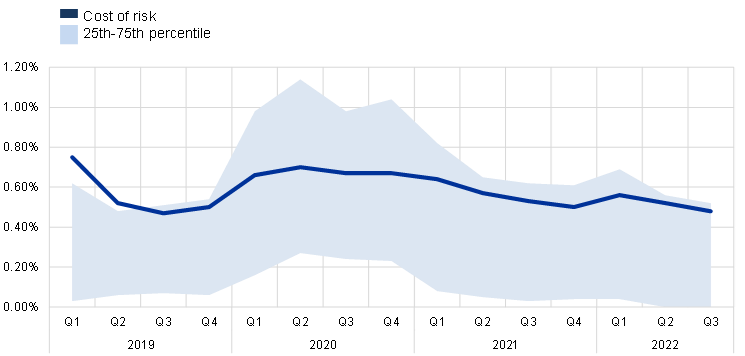
Cost of risk stood at an aggregate level of 0.48% in the third quarter of 2022 (down from 0.52% in the previous quarter). Across significant institutions, the interquartile range narrowed further to 0.52 percentage points (down from 0.56 percentage points in the previous quarter).
Non-performing loans by reference period
Non-performing loans ratio by home country for the third quarter of 2022
Non-performing loans ratio by business model for the third quarter of 2022
Loans and advances subject to impairment review by reference period
Cost of risk by reference period
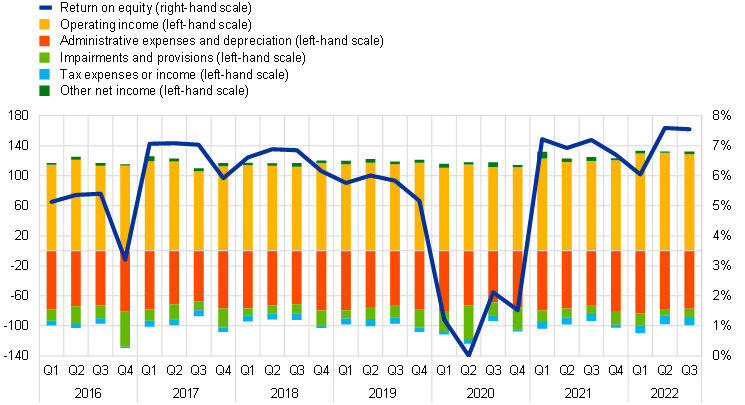
The aggregated annualised return on equity was stable at 7.55% in the third quarter of 2022 (compared with 7.59% in the previous quarter). Higher net interest income was a key profitability driver compared with both the previous quarter (increase of €2.5 billion) and with the same quarter of 2021 (increase of €17.9 billion).
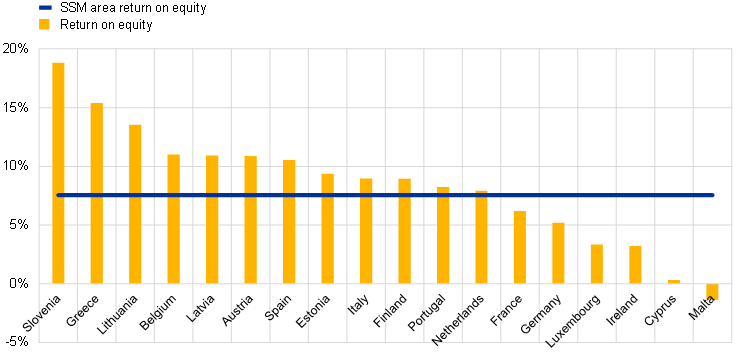
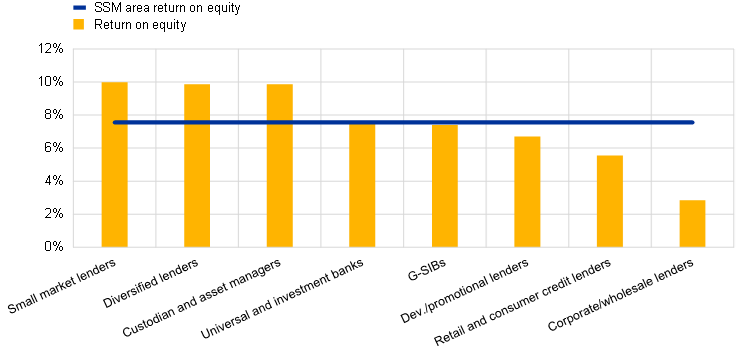
Significant institutions from Slovenia showed the highest aggregated annualised return on equity in the third quarter of 2022 (18.80%) while significant institutions from Malta showed the lowest (-1.36%). Across Single Supervisory Mechanism business model categories, the aggregate annualised return on equity ranged from 9.97% for small market lenders to 2.84% for corporate/wholesale lenders.
Return on equity and composition of net profit and loss by reference period
Return on equity by home country for the third quarter of 2022
Return on equity by business model for the third quarter of 2022
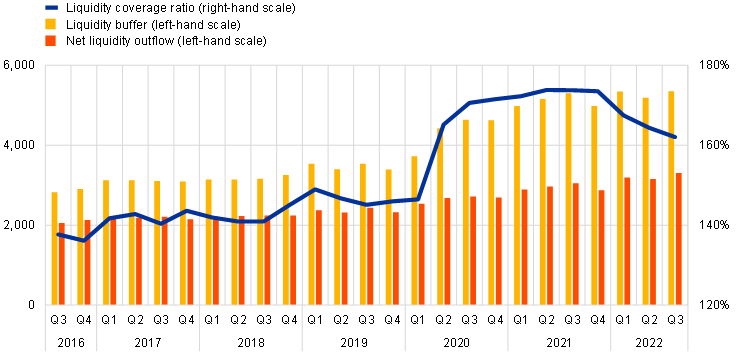
The aggregate liquidity coverage ratio stood at 162.03% in the third quarter of 2022, down from 164.38% in the previous quarter. Both the liquidity buffer and the net liquidity outflow increased compared with the previous quarter (by €160 billion and €144 billion respectively).
Liquidity coverage ratio and its components by reference period
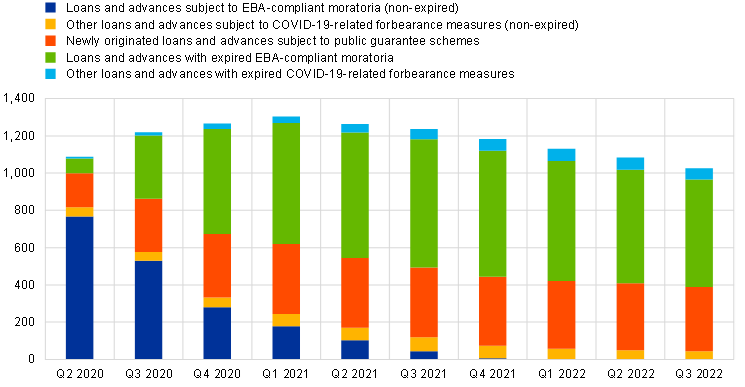
In the third quarter of 2022 total non-expired loans and advances subject to COVID-19-related measures decreased further to €388 billion, down from €409 billion in the previous quarter. The decrease was driven by newly originated loans and advances subject to public guarantee schemes, which declined to €345 billion from €360 billion in the previous quarter.
Loans and advances subject to COVID-19-related measures by reference period
Supervisory banking statistics are calculated by aggregating the data that are reported by banks which report COREP (capital adequacy information) and FINREP (financial information) at the relevant point in time. Consequently, changes from one quarter to the next can be influenced by the following factors:
For media queries, please contact Philippe Rispal, tel.: +49 69 1344 5482.